 English (UK)
 English (US)
 Français
 Deutsch
 Español
 Italiano
 Nederlands
 简体中文
Organiser son emploi du temps
Où aller chaque mois
Pick the month you can travel and see which of our 41 regions suit it, with the numbers behind each suggestion: Met Office averages for temperature, rain and sunshine, calculated daylight, dated events and bank holidays.

Choisissez un mois
-
Janvier
Warmest highs: Devon (9.7°C). Driest: Newcastle and Gateshead (46 mm).
0 of 41 regions pass every outdoor check.
Où aller en janvier -
Février
Warmest highs: Devon (9.7°C). Driest: Cambridge (36 mm).
0 of 41 regions pass every outdoor check.
Où aller en février -
Mars
Warmest highs: Windsor (11.7°C). Driest: Cambridge (33 mm).
20 of 41 regions pass every outdoor check.
Où aller en mars -
Avril
Warmest highs: Windsor (15.0°C). Driest: Cambridge (38 mm).
32 of 41 regions pass every outdoor check.
Où aller en avril -
mai
Warmest highs: Windsor (18.4°C). Driest: Newcastle and Gateshead (42 mm).
33 of 41 regions pass every outdoor check.
Où aller en mai -
Juin
Warmest highs: Windsor (21.6°C). Driest: Canterbury & Kent (45 mm).
32 of 41 regions pass every outdoor check.
Où aller en juin -
Juillet
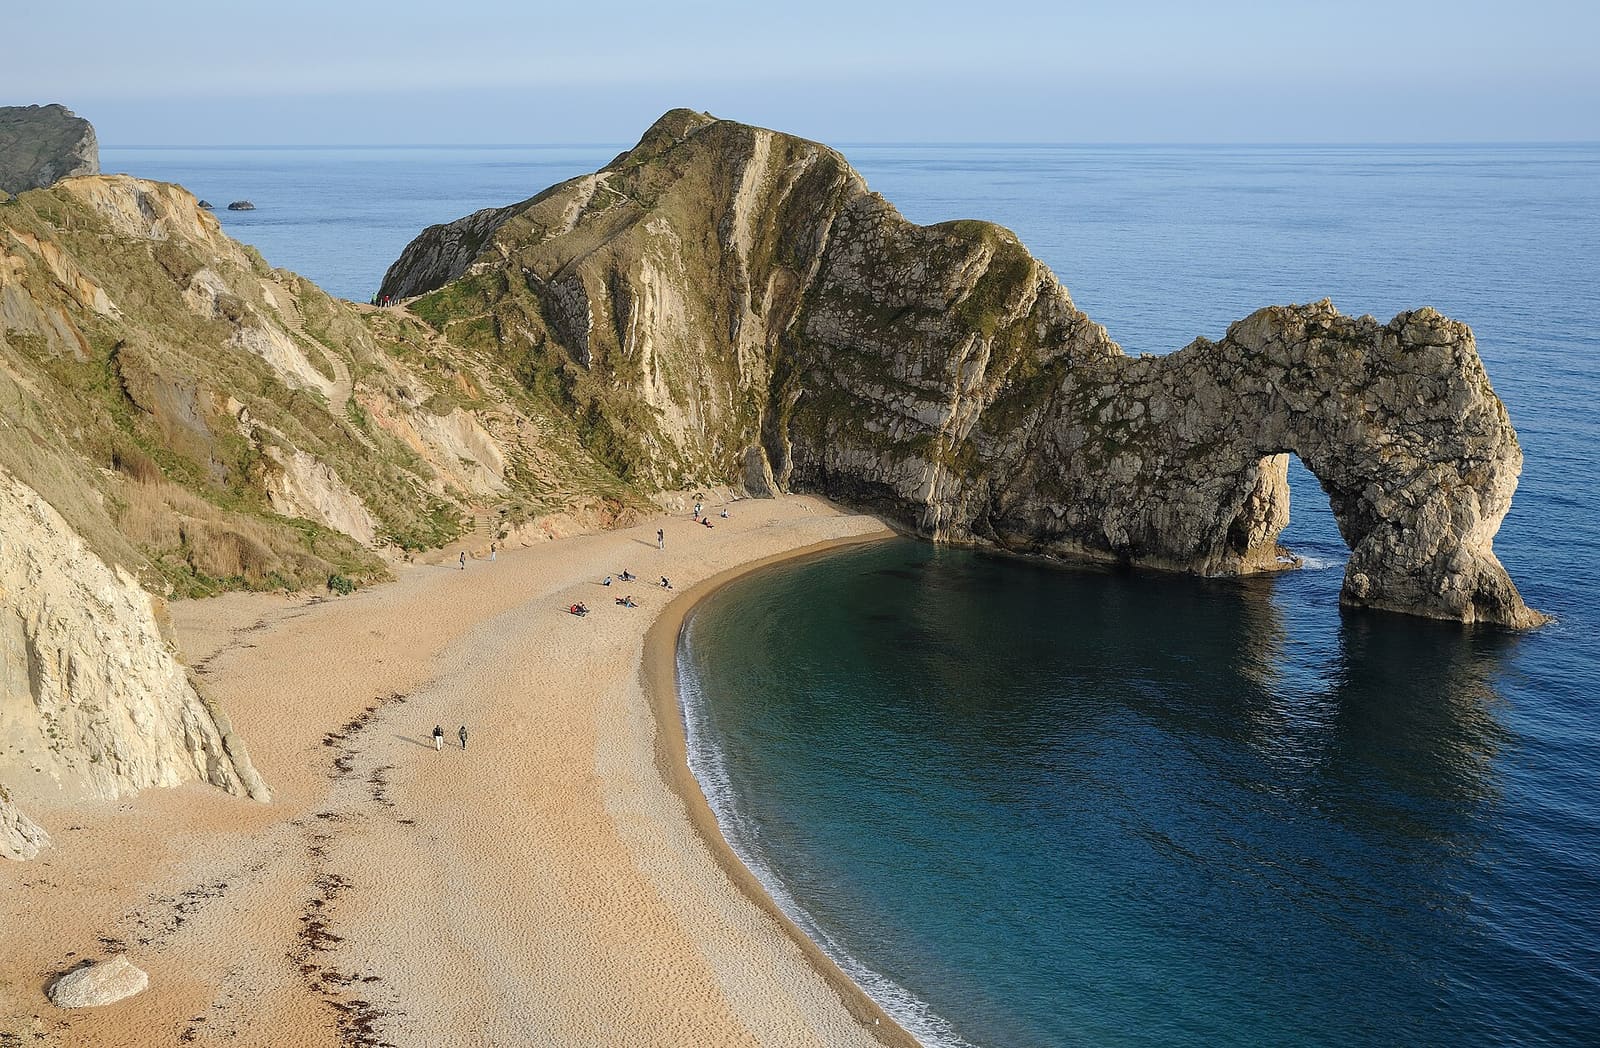
Warmest highs: Windsor (23.9°C). Driest: The Jurassic Coast (41 mm).
27 of 41 regions pass every outdoor check.
Où aller en juillet -
Août
Warmest highs: Windsor (23.4°C). Driest: Windsor (53 mm).
24 of 41 regions pass every outdoor check.
Où aller en août -
Septembre
Warmest highs: Windsor (20.2°C). Driest: Newcastle and Gateshead (45 mm).
27 of 41 regions pass every outdoor check.
Où aller en septembre -
Octobre
Warmest highs: Portsmouth and Southampton (15.9°C). Driest: Newcastle and Gateshead (55 mm).
10 of 41 regions pass every outdoor check.
Où aller en octobre -
Novembre
Warmest highs: Devon (12.5°C). Driest: Cambridge (53 mm).
0 of 41 regions pass every outdoor check.
Où aller en novembre -
Décembre
Warmest highs: Devon (10.3°C). Driest: Cambridge (49 mm).
0 of 41 regions pass every outdoor check.
Où aller en décembre


Température maximale moyenne par mois (°C)
Température maximale quotidienne moyenne, d'après les moyennes 1991-2020 du Met Office, à une station par région. Les cellules bleues indiquent moins de 10°C.
| Région | janv. | Févr. | Mars | Avr. | mai | juin | juil. | Août | Sept. | Oct. | nov. | Déc |
|---|---|---|---|---|---|---|---|---|---|---|---|---|
| Anglesey | 8.4 | 8.4 | 9.8 | 12.1 | 15.0 | 17.2 | 18.8 | 18.8 | 17.3 | 14.3 | 11.3 | 9.1 |
| Bath | 8.0 | 8.5 | 10.9 | 14.0 | 17.1 | 20.0 | 21.8 | 21.6 | 19.1 | 14.9 | 11.2 | 8.5 |
| Birmingham | 7.1 | 7.7 | 10.3 | 13.4 | 16.5 | 19.3 | 21.5 | 21.0 | 18.1 | 13.9 | 9.9 | 7.3 |
| Brighton & Hove | 8.2 | 8.4 | 10.5 | 13.1 | 16.3 | 19.1 | 20.9 | 21.0 | 18.9 | 15.5 | 11.6 | 8.9 |
| Bristol | 8.1 | 8.5 | 10.8 | 13.8 | 17.0 | 19.8 | 21.7 | 21.3 | 18.8 | 14.8 | 11.0 | 8.4 |
| Cambridge | 7.7 | 8.3 | 11.0 | 14.1 | 17.4 | 20.4 | 23.1 | 22.9 | 19.6 | 15.1 | 10.7 | 8.0 |
| Canterbury & Kent | 7.9 | 8.4 | 11.0 | 14.2 | 17.3 | 20.5 | 23.1 | 23.1 | 19.7 | 15.5 | 11.1 | 8.5 |
| Cardiff | 8.6 | 9.2 | 11.3 | 14.3 | 17.4 | 20.1 | 21.8 | 21.4 | 19.1 | 15.2 | 11.6 | 9.1 |
| Cornouailles | 9.2 | 9.2 | 10.2 | 12.1 | 14.5 | 16.9 | 18.7 | 19.0 | 17.4 | 14.6 | 11.8 | 9.9 |
| Devon | 9.7 | 9.7 | 11.2 | 13.4 | 16.2 | 19.0 | 21.1 | 21.0 | 19.0 | 15.7 | 12.5 | 10.3 |
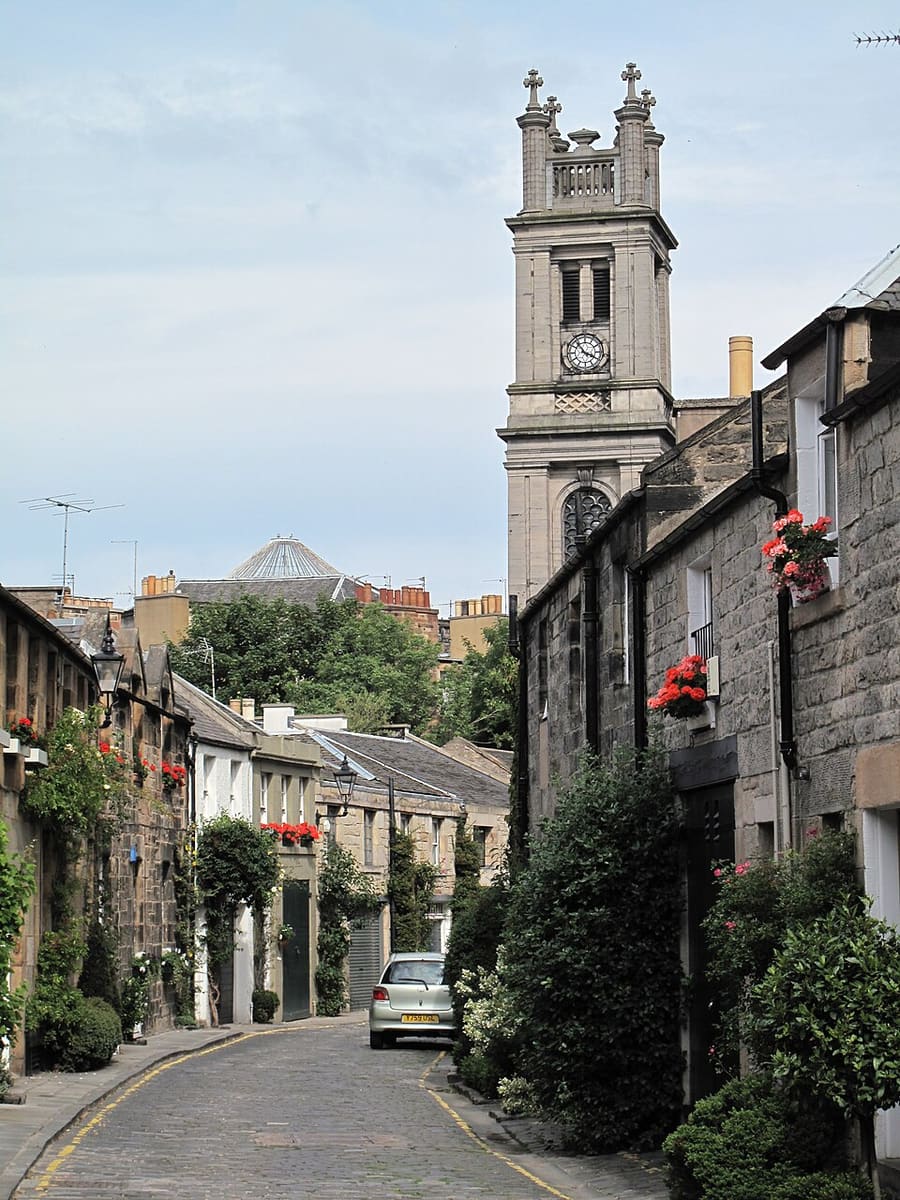
| Édimbourg | 7.3 | 8.0 | 9.7 | 12.2 | 14.9 | 17.4 | 19.3 | 19.1 | 16.9 | 13.4 | 9.9 | 7.3 |
| Glasgow | 7.2 | 7.8 | 9.8 | 13.0 | 16.1 | 18.4 | 19.8 | 19.3 | 16.7 | 13.0 | 9.6 | 7.4 |
| Islay and Jura | 7.9 | 8.0 | 9.3 | 11.4 | 14.1 | 16.0 | 17.3 | 17.3 | 15.8 | 13.0 | 10.3 | 8.5 |
| Isle of Arran | 7.5 | 7.8 | 9.4 | 12.0 | 15.0 | 17.2 | 18.7 | 18.4 | 16.3 | 12.9 | 9.8 | 7.8 |
| Isle of Bute | 7.5 | 7.8 | 9.4 | 12.0 | 15.0 | 17.2 | 18.7 | 18.4 | 16.3 | 12.9 | 9.8 | 7.8 |
| Leeds | 7.3 | 8.1 | 10.5 | 13.3 | 16.4 | 19.1 | 21.5 | 21.0 | 18.3 | 14.2 | 10.2 | 7.5 |
| Liverpool | 7.5 | 7.9 | 9.9 | 12.8 | 15.9 | 18.4 | 20.0 | 19.7 | 17.7 | 14.2 | 10.5 | 8.0 |
| Manchester | 7.1 | 7.9 | 10.1 | 13.0 | 16.3 | 18.9 | 20.7 | 20.2 | 17.6 | 13.8 | 10.0 | 7.5 |
| Mull and Iona | 7.5 | 7.8 | 9.3 | 11.9 | 14.9 | 16.8 | 18.2 | 18.1 | 16.2 | 13.1 | 10.0 | 8.0 |
| Newcastle and Gateshead | 7.4 | 7.9 | 9.3 | 10.9 | 13.3 | 16.0 | 18.4 | 18.3 | 16.2 | 13.5 | 10.0 | 7.7 |
| Norfolk and the Broads | 7.5 | 8.1 | 10.3 | 13.2 | 16.3 | 19.2 | 21.6 | 21.7 | 18.9 | 14.9 | 10.8 | 8.0 |
| North Coast 500 | 6.4 | 6.7 | 8.1 | 10.0 | 12.0 | 14.3 | 16.2 | 16.3 | 14.7 | 11.8 | 8.9 | 6.8 |
| Irlande du Nord | 8.2 | 8.8 | 10.5 | 12.8 | 15.7 | 18.2 | 19.7 | 19.4 | 17.3 | 13.8 | 10.7 | 8.4 |
| Nottingham | 6.9 | 7.7 | 10.1 | 13.2 | 16.4 | 19.2 | 21.5 | 21.1 | 18.1 | 13.9 | 9.8 | 7.2 |
| Orkney | 6.6 | 6.8 | 8.0 | 9.9 | 12.2 | 14.2 | 16.1 | 16.2 | 14.4 | 11.6 | 8.9 | 7.0 |
| Oxford | 8.0 | 8.6 | 11.3 | 14.4 | 17.7 | 20.7 | 23.1 | 22.5 | 19.4 | 15.1 | 10.9 | 8.2 |
| Portsmouth and Southampton | 8.8 | 9.1 | 11.5 | 14.7 | 18.0 | 20.6 | 22.6 | 22.5 | 20.1 | 15.9 | 12.0 | 9.3 |
| Salisbury & Stonehenge | 7.6 | 8.1 | 10.7 | 13.7 | 17.0 | 19.8 | 22.1 | 21.6 | 18.9 | 14.7 | 10.6 | 8.0 |
| Sheffield | 7.0 | 7.7 | 10.0 | 13.1 | 16.4 | 19.2 | 21.4 | 20.8 | 17.9 | 13.7 | 9.8 | 7.3 |
| St Andrews and Fife | 6.8 | 7.7 | 9.6 | 11.8 | 14.5 | 17.1 | 19.3 | 19.0 | 16.8 | 13.2 | 9.5 | 7.0 |
| Stirling and the Trossachs | 7.3 | 8.1 | 9.9 | 12.3 | 15.7 | 18.1 | 19.9 | 19.5 | 17.1 | 13.5 | 9.9 | 7.5 |
| Stratford & Warwickshire | 7.7 | 8.4 | 10.9 | 14.1 | 17.3 | 20.3 | 22.8 | 22.4 | 19.3 | 14.9 | 10.6 | 8.0 |
| Les Cotswolds | 7.4 | 8.0 | 10.7 | 13.7 | 16.8 | 19.8 | 22.3 | 21.8 | 18.9 | 14.5 | 10.3 | 7.7 |
| Côte jurassique | 9.0 | 8.9 | 10.6 | 12.9 | 15.7 | 18.1 | 20.0 | 20.3 | 18.7 | 15.5 | 12.2 | 9.7 |
| Lake District | 7.4 | 7.8 | 9.7 | 12.4 | 15.8 | 18.2 | 19.8 | 19.2 | 17.0 | 13.5 | 10.0 | 7.8 |
| The Outer Hebrides | 7.5 | 7.5 | 8.5 | 10.4 | 12.6 | 14.5 | 16.3 | 16.4 | 14.7 | 12.0 | 9.5 | 7.8 |
| Peak District | 5.5 | 5.9 | 8.2 | 11.2 | 14.5 | 17.2 | 19.1 | 18.6 | 15.8 | 11.8 | 8.2 | 5.9 |
| Highlands écossaises | 7.1 | 7.6 | 9.5 | 12.1 | 14.8 | 17.0 | 18.9 | 18.7 | 16.5 | 12.8 | 9.5 | 7.3 |
| Pays de Galles | 8.6 | 9.2 | 11.3 | 14.3 | 17.4 | 20.1 | 21.8 | 21.4 | 19.1 | 15.2 | 11.6 | 9.1 |
| Windsor | 8.4 | 9.0 | 11.7 | 15.0 | 18.4 | 21.6 | 23.9 | 23.4 | 20.2 | 15.8 | 11.5 | 8.8 |
| York | 7.3 | 8.1 | 10.5 | 13.3 | 16.4 | 19.1 | 21.5 | 21.0 | 18.3 | 14.2 | 10.2 | 7.5 |
Précipitations par mois (mm)
Précipitations totales du mois. Les cases bleues indiquent 80 mm ou plus, l’un des trois seuils de temps pluvieux que nous utilisons.
| Région | janv. | Févr. | Mars | Avr. | mai | juin | juil. | Août | Sept. | Oct. | nov. | Déc |
|---|---|---|---|---|---|---|---|---|---|---|---|---|
| Anglesey | 75 | 62 | 57 | 54 | 52 | 57 | 57 | 69 | 74 | 102 | 103 | 93 |
| Bath | 83 | 57 | 58 | 58 | 59 | 55 | 58 | 74 | 63 | 86 | 89 | 91 |
| Birmingham | 72 | 55 | 51 | 56 | 61 | 68 | 66 | 68 | 68 | 81 | 79 | 84 |
| Brighton & Hove | 80 | 57 | 46 | 45 | 46 | 47 | 54 | 59 | 59 | 82 | 90 | 87 |
| Bristol | 82 | 58 | 53 | 48 | 58 | 56 | 59 | 75 | 64 | 86 | 90 | 90 |
| Cambridge | 49 | 36 | 33 | 38 | 43 | 49 | 48 | 56 | 48 | 59 | 53 | 49 |
| Canterbury & Kent | 64 | 50 | 39 | 45 | 50 | 45 | 43 | 57 | 55 | 80 | 75 | 72 |
| Cardiff | 127 | 93 | 85 | 72 | 78 | 74 | 84 | 105 | 86 | 129 | 131 | 140 |
| Cornouailles | 121 | 95 | 72 | 73 | 61 | 63 | 69 | 78 | 78 | 111 | 130 | 126 |
| Devon | 97 | 73 | 67 | 61 | 54 | 55 | 46 | 62 | 57 | 102 | 98 | 101 |
| Édimbourg | 65 | 53 | 48 | 41 | 48 | 66 | 72 | 72 | 55 | 76 | 65 | 67 |
| Glasgow | 146 | 115 | 97 | 66 | 69 | 68 | 83 | 95 | 98 | 132 | 132 | 161 |
| Islay and Jura | 137 | 110 | 102 | 76 | 70 | 81 | 88 | 107 | 108 | 143 | 143 | 142 |
| Isle of Arran | 166 | 127 | 119 | 86 | 79 | 90 | 108 | 124 | 117 | 163 | 159 | 160 |
| Isle of Bute | 166 | 127 | 119 | 86 | 79 | 90 | 108 | 124 | 117 | 163 | 159 | 160 |
| Leeds | 49 | 42 | 41 | 43 | 43 | 55 | 52 | 62 | 56 | 58 | 59 | 58 |
| Liverpool | 69 | 57 | 53 | 50 | 52 | 64 | 65 | 72 | 77 | 90 | 82 | 92 |
| Manchester | 77 | 60 | 53 | 56 | 56 | 65 | 80 | 80 | 76 | 92 | 77 | 97 |
| Mull and Iona | 206 | 156 | 137 | 92 | 95 | 96 | 110 | 130 | 141 | 189 | 178 | 198 |
| Newcastle and Gateshead | 46 | 41 | 39 | 43 | 42 | 56 | 52 | 64 | 45 | 55 | 71 | 55 |
| Norfolk and the Broads | 55 | 45 | 46 | 39 | 47 | 63 | 57 | 66 | 60 | 70 | 71 | 64 |
| North Coast 500 | 72 | 63 | 57 | 47 | 50 | 55 | 62 | 70 | 66 | 93 | 88 | 70 |
| Irlande du Nord | 89 | 70 | 71 | 60 | 60 | 69 | 74 | 85 | 70 | 96 | 102 | 93 |
| Nottingham | 59 | 50 | 46 | 48 | 50 | 67 | 65 | 64 | 57 | 72 | 69 | 70 |
| Orkney | 115 | 96 | 87 | 59 | 54 | 56 | 58 | 73 | 91 | 120 | 126 | 114 |
| Oxford | 60 | 47 | 43 | 49 | 57 | 50 | 53 | 62 | 52 | 73 | 71 | 66 |
| Portsmouth and Southampton | 89 | 64 | 56 | 52 | 47 | 57 | 44 | 59 | 60 | 93 | 100 | 97 |
| Salisbury & Stonehenge | 79 | 57 | 54 | 55 | 50 | 54 | 55 | 59 | 58 | 86 | 91 | 85 |
| Sheffield | 76 | 67 | 60 | 59 | 55 | 75 | 62 | 65 | 63 | 79 | 85 | 87 |
| St Andrews and Fife | 63 | 47 | 46 | 44 | 50 | 63 | 64 | 69 | 54 | 80 | 68 | 63 |
| Stirling and the Trossachs | 129 | 97 | 74 | 51 | 57 | 67 | 70 | 76 | 76 | 107 | 109 | 103 |
| Stratford & Warwickshire | 52 | 40 | 40 | 46 | 55 | 52 | 57 | 60 | 51 | 63 | 59 | 56 |
| Les Cotswolds | 83 | 58 | 56 | 56 | 64 | 59 | 59 | 67 | 58 | 84 | 89 | 90 |
| Côte jurassique | 84 | 60 | 58 | 52 | 45 | 46 | 41 | 55 | 55 | 83 | 99 | 92 |
| Lake District | 172 | 135 | 115 | 83 | 82 | 90 | 95 | 120 | 124 | 175 | 189 | 195 |
| The Outer Hebrides | 145 | 112 | 105 | 74 | 69 | 65 | 74 | 88 | 104 | 133 | 128 | 139 |
| Peak District | 127 | 116 | 100 | 87 | 82 | 93 | 101 | 101 | 106 | 142 | 136 | 153 |
| Highlands écossaises | 76 | 61 | 53 | 41 | 56 | 62 | 62 | 65 | 63 | 78 | 67 | 73 |
| Pays de Galles | 127 | 93 | 85 | 72 | 78 | 74 | 84 | 105 | 86 | 129 | 131 | 140 |
| Windsor | 59 | 45 | 39 | 42 | 46 | 47 | 46 | 53 | 50 | 65 | 67 | 57 |
| York | 49 | 42 | 41 | 43 | 43 | 55 | 52 | 62 | 56 | 58 | 59 | 58 |
Il ne s'agit pas d'un classement. « Réussit tous les critères en extérieur » signifie que les moyennes du Met Office pour ce mois restent en deçà de nos seuils de froid, de pluie et de journées courtes. Cela ne veut pas dire « le meilleur », et cela ne dit rien de l'affluence ni des prix, que nous ne publions pas car aucune source consultée ne les indique.
Londres n’a pas encore de station du Met Office dans nos données : consultez quand partir à Londres. Vous hésitez entre deux destinations ? Comparez les destinations.
Sources : moyennes à long terme par localité 1991-2020 du Met Office (Open Government Licence v3.0), pages de station liées pour chaque mois ; jours fériés de GOV.UK ; organisateurs d'événements, liés sur chaque événement. La durée du jour est calculée d'après la latitude. Les moyennes décrivent un mois type, et non une prévision.