 English (UK)
 English (US)
 Français
 Deutsch
 Español
 Italiano
 Nederlands
 简体中文
Planificar los horarios
Adónde ir cada mes
Pick the month you can travel and see which of our 41 regions suit it, with the numbers behind each suggestion: Met Office averages for temperature, rain and sunshine, calculated daylight, dated events and bank holidays.

Elija un mes
-
Enero
Warmest highs: Devon (9.7°C). Driest: Newcastle and Gateshead (46 mm).
0 of 41 regions pass every outdoor check.
Adónde ir en enero -
Febrero
Warmest highs: Devon (9.7°C). Driest: Cambridge (36 mm).
0 of 41 regions pass every outdoor check.
Adónde ir en febrero -
Marzo
Warmest highs: Windsor (11.7°C). Driest: Cambridge (33 mm).
20 of 41 regions pass every outdoor check.
Adónde ir en marzo -
Abril
Warmest highs: Windsor (15.0°C). Driest: Cambridge (38 mm).
32 of 41 regions pass every outdoor check.
Adónde ir en abril -
may
Warmest highs: Windsor (18.4°C). Driest: Newcastle and Gateshead (42 mm).
33 of 41 regions pass every outdoor check.
Adónde ir en mayo -
Junio
Warmest highs: Windsor (21.6°C). Driest: Canterbury & Kent (45 mm).
32 of 41 regions pass every outdoor check.
Adónde ir en junio -
Julio
Warmest highs: Windsor (23.9°C). Driest: The Jurassic Coast (41 mm).
27 of 41 regions pass every outdoor check.
Adónde ir en julio -
Agosto
Warmest highs: Windsor (23.4°C). Driest: Windsor (53 mm).
24 of 41 regions pass every outdoor check.
Adónde ir en agosto -
Septiembre
Warmest highs: Windsor (20.2°C). Driest: Newcastle and Gateshead (45 mm).
27 of 41 regions pass every outdoor check.
Adónde ir en septiembre -
Octubre
Warmest highs: Portsmouth and Southampton (15.9°C). Driest: Newcastle and Gateshead (55 mm).
10 of 41 regions pass every outdoor check.
Adónde ir en octubre -
Noviembre
Warmest highs: Devon (12.5°C). Driest: Cambridge (53 mm).
0 of 41 regions pass every outdoor check.
Adónde ir en noviembre -
Diciembre
Warmest highs: Devon (10.3°C). Driest: Cambridge (49 mm).
0 of 41 regions pass every outdoor check.
Adónde ir en diciembre


Temperatura máxima diaria media por mes (°C)
Temperatura máxima diaria media según los promedios 1991-2020 del Met Office, en una estación por región. Las celdas azules están por debajo de 10°C.
| Región | ene | Feb | Mar | Abr | may | jun | jul | ago | Sep | Oct | nov | dic |
|---|---|---|---|---|---|---|---|---|---|---|---|---|
| Anglesey | 8.4 | 8.4 | 9.8 | 12.1 | 15.0 | 17.2 | 18.8 | 18.8 | 17.3 | 14.3 | 11.3 | 9.1 |
| Bath | 8.0 | 8.5 | 10.9 | 14.0 | 17.1 | 20.0 | 21.8 | 21.6 | 19.1 | 14.9 | 11.2 | 8.5 |
| Birmingham | 7.1 | 7.7 | 10.3 | 13.4 | 16.5 | 19.3 | 21.5 | 21.0 | 18.1 | 13.9 | 9.9 | 7.3 |
| Brighton & Hove | 8.2 | 8.4 | 10.5 | 13.1 | 16.3 | 19.1 | 20.9 | 21.0 | 18.9 | 15.5 | 11.6 | 8.9 |
| Bristol | 8.1 | 8.5 | 10.8 | 13.8 | 17.0 | 19.8 | 21.7 | 21.3 | 18.8 | 14.8 | 11.0 | 8.4 |
| Cambridge | 7.7 | 8.3 | 11.0 | 14.1 | 17.4 | 20.4 | 23.1 | 22.9 | 19.6 | 15.1 | 10.7 | 8.0 |
| Canterbury & Kent | 7.9 | 8.4 | 11.0 | 14.2 | 17.3 | 20.5 | 23.1 | 23.1 | 19.7 | 15.5 | 11.1 | 8.5 |
| Cardiff | 8.6 | 9.2 | 11.3 | 14.3 | 17.4 | 20.1 | 21.8 | 21.4 | 19.1 | 15.2 | 11.6 | 9.1 |
| Cornualles | 9.2 | 9.2 | 10.2 | 12.1 | 14.5 | 16.9 | 18.7 | 19.0 | 17.4 | 14.6 | 11.8 | 9.9 |
| Devon | 9.7 | 9.7 | 11.2 | 13.4 | 16.2 | 19.0 | 21.1 | 21.0 | 19.0 | 15.7 | 12.5 | 10.3 |
| Edimburgo | 7.3 | 8.0 | 9.7 | 12.2 | 14.9 | 17.4 | 19.3 | 19.1 | 16.9 | 13.4 | 9.9 | 7.3 |
| Glasgow | 7.2 | 7.8 | 9.8 | 13.0 | 16.1 | 18.4 | 19.8 | 19.3 | 16.7 | 13.0 | 9.6 | 7.4 |
| Islay and Jura | 7.9 | 8.0 | 9.3 | 11.4 | 14.1 | 16.0 | 17.3 | 17.3 | 15.8 | 13.0 | 10.3 | 8.5 |
| Isle of Arran | 7.5 | 7.8 | 9.4 | 12.0 | 15.0 | 17.2 | 18.7 | 18.4 | 16.3 | 12.9 | 9.8 | 7.8 |
| Isle of Bute | 7.5 | 7.8 | 9.4 | 12.0 | 15.0 | 17.2 | 18.7 | 18.4 | 16.3 | 12.9 | 9.8 | 7.8 |
| Leeds | 7.3 | 8.1 | 10.5 | 13.3 | 16.4 | 19.1 | 21.5 | 21.0 | 18.3 | 14.2 | 10.2 | 7.5 |
| Liverpool | 7.5 | 7.9 | 9.9 | 12.8 | 15.9 | 18.4 | 20.0 | 19.7 | 17.7 | 14.2 | 10.5 | 8.0 |
| Manchester | 7.1 | 7.9 | 10.1 | 13.0 | 16.3 | 18.9 | 20.7 | 20.2 | 17.6 | 13.8 | 10.0 | 7.5 |
| Mull and Iona | 7.5 | 7.8 | 9.3 | 11.9 | 14.9 | 16.8 | 18.2 | 18.1 | 16.2 | 13.1 | 10.0 | 8.0 |
| Newcastle and Gateshead | 7.4 | 7.9 | 9.3 | 10.9 | 13.3 | 16.0 | 18.4 | 18.3 | 16.2 | 13.5 | 10.0 | 7.7 |
| Norfolk and the Broads | 7.5 | 8.1 | 10.3 | 13.2 | 16.3 | 19.2 | 21.6 | 21.7 | 18.9 | 14.9 | 10.8 | 8.0 |
| North Coast 500 | 6.4 | 6.7 | 8.1 | 10.0 | 12.0 | 14.3 | 16.2 | 16.3 | 14.7 | 11.8 | 8.9 | 6.8 |
| Irlanda del Norte | 8.2 | 8.8 | 10.5 | 12.8 | 15.7 | 18.2 | 19.7 | 19.4 | 17.3 | 13.8 | 10.7 | 8.4 |
| Nottingham | 6.9 | 7.7 | 10.1 | 13.2 | 16.4 | 19.2 | 21.5 | 21.1 | 18.1 | 13.9 | 9.8 | 7.2 |
| Orkney | 6.6 | 6.8 | 8.0 | 9.9 | 12.2 | 14.2 | 16.1 | 16.2 | 14.4 | 11.6 | 8.9 | 7.0 |
| Oxford | 8.0 | 8.6 | 11.3 | 14.4 | 17.7 | 20.7 | 23.1 | 22.5 | 19.4 | 15.1 | 10.9 | 8.2 |
| Portsmouth and Southampton | 8.8 | 9.1 | 11.5 | 14.7 | 18.0 | 20.6 | 22.6 | 22.5 | 20.1 | 15.9 | 12.0 | 9.3 |
| Salisbury & Stonehenge | 7.6 | 8.1 | 10.7 | 13.7 | 17.0 | 19.8 | 22.1 | 21.6 | 18.9 | 14.7 | 10.6 | 8.0 |
| Sheffield | 7.0 | 7.7 | 10.0 | 13.1 | 16.4 | 19.2 | 21.4 | 20.8 | 17.9 | 13.7 | 9.8 | 7.3 |
| St Andrews and Fife | 6.8 | 7.7 | 9.6 | 11.8 | 14.5 | 17.1 | 19.3 | 19.0 | 16.8 | 13.2 | 9.5 | 7.0 |
| Stirling and the Trossachs | 7.3 | 8.1 | 9.9 | 12.3 | 15.7 | 18.1 | 19.9 | 19.5 | 17.1 | 13.5 | 9.9 | 7.5 |
| Stratford & Warwickshire | 7.7 | 8.4 | 10.9 | 14.1 | 17.3 | 20.3 | 22.8 | 22.4 | 19.3 | 14.9 | 10.6 | 8.0 |
| Los Cotswolds | 7.4 | 8.0 | 10.7 | 13.7 | 16.8 | 19.8 | 22.3 | 21.8 | 18.9 | 14.5 | 10.3 | 7.7 |
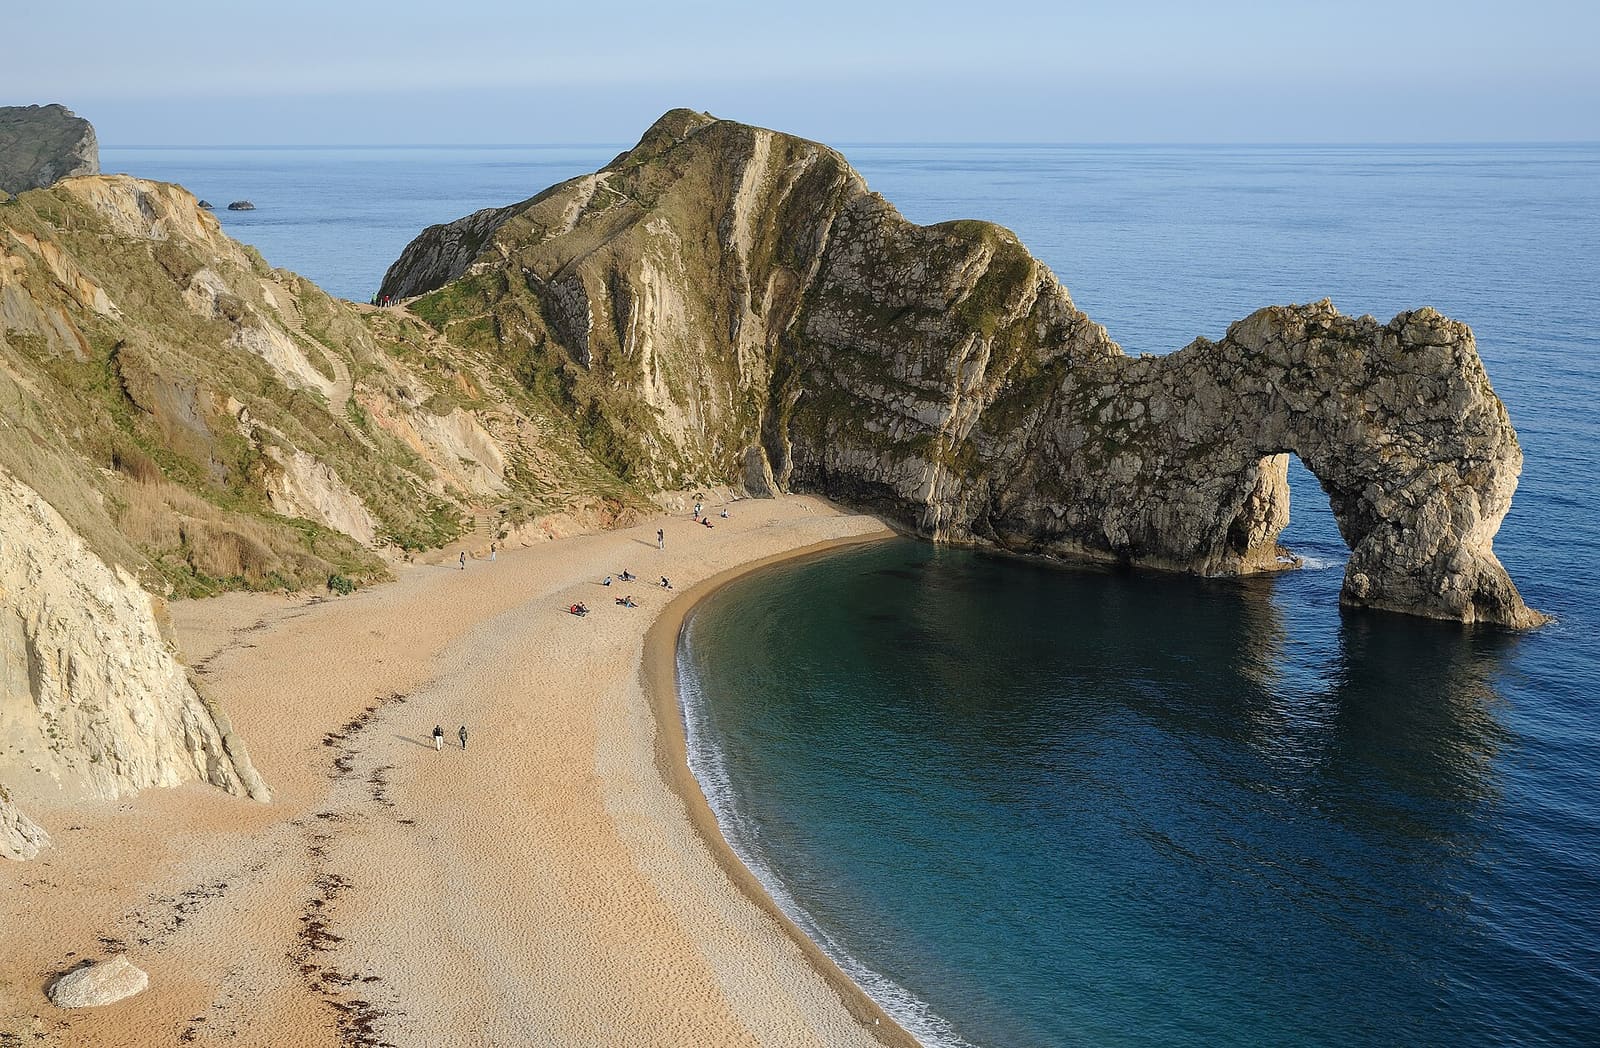
| Costa Jurásica | 9.0 | 8.9 | 10.6 | 12.9 | 15.7 | 18.1 | 20.0 | 20.3 | 18.7 | 15.5 | 12.2 | 9.7 |
| Distrito de los Lagos | 7.4 | 7.8 | 9.7 | 12.4 | 15.8 | 18.2 | 19.8 | 19.2 | 17.0 | 13.5 | 10.0 | 7.8 |
| The Outer Hebrides | 7.5 | 7.5 | 8.5 | 10.4 | 12.6 | 14.5 | 16.3 | 16.4 | 14.7 | 12.0 | 9.5 | 7.8 |
| The Peak District | 5.5 | 5.9 | 8.2 | 11.2 | 14.5 | 17.2 | 19.1 | 18.6 | 15.8 | 11.8 | 8.2 | 5.9 |
| Highlands escocesas | 7.1 | 7.6 | 9.5 | 12.1 | 14.8 | 17.0 | 18.9 | 18.7 | 16.5 | 12.8 | 9.5 | 7.3 |
| Gales | 8.6 | 9.2 | 11.3 | 14.3 | 17.4 | 20.1 | 21.8 | 21.4 | 19.1 | 15.2 | 11.6 | 9.1 |
| Windsor | 8.4 | 9.0 | 11.7 | 15.0 | 18.4 | 21.6 | 23.9 | 23.4 | 20.2 | 15.8 | 11.5 | 8.8 |
| York | 7.3 | 8.1 | 10.5 | 13.3 | 16.4 | 19.1 | 21.5 | 21.0 | 18.3 | 14.2 | 10.2 | 7.5 |
Precipitaciones por mes (mm)
Lluvia total del mes. Las celdas azules marcan 80 mm o más, uno de los tres umbrales de tiempo lluvioso que utilizamos.
| Región | ene | Feb | Mar | Abr | may | jun | jul | ago | Sep | Oct | nov | dic |
|---|---|---|---|---|---|---|---|---|---|---|---|---|
| Anglesey | 75 | 62 | 57 | 54 | 52 | 57 | 57 | 69 | 74 | 102 | 103 | 93 |
| Bath | 83 | 57 | 58 | 58 | 59 | 55 | 58 | 74 | 63 | 86 | 89 | 91 |
| Birmingham | 72 | 55 | 51 | 56 | 61 | 68 | 66 | 68 | 68 | 81 | 79 | 84 |
| Brighton & Hove | 80 | 57 | 46 | 45 | 46 | 47 | 54 | 59 | 59 | 82 | 90 | 87 |
| Bristol | 82 | 58 | 53 | 48 | 58 | 56 | 59 | 75 | 64 | 86 | 90 | 90 |
| Cambridge | 49 | 36 | 33 | 38 | 43 | 49 | 48 | 56 | 48 | 59 | 53 | 49 |
| Canterbury & Kent | 64 | 50 | 39 | 45 | 50 | 45 | 43 | 57 | 55 | 80 | 75 | 72 |
| Cardiff | 127 | 93 | 85 | 72 | 78 | 74 | 84 | 105 | 86 | 129 | 131 | 140 |
| Cornualles | 121 | 95 | 72 | 73 | 61 | 63 | 69 | 78 | 78 | 111 | 130 | 126 |
| Devon | 97 | 73 | 67 | 61 | 54 | 55 | 46 | 62 | 57 | 102 | 98 | 101 |
| Edimburgo | 65 | 53 | 48 | 41 | 48 | 66 | 72 | 72 | 55 | 76 | 65 | 67 |
| Glasgow | 146 | 115 | 97 | 66 | 69 | 68 | 83 | 95 | 98 | 132 | 132 | 161 |
| Islay and Jura | 137 | 110 | 102 | 76 | 70 | 81 | 88 | 107 | 108 | 143 | 143 | 142 |
| Isle of Arran | 166 | 127 | 119 | 86 | 79 | 90 | 108 | 124 | 117 | 163 | 159 | 160 |
| Isle of Bute | 166 | 127 | 119 | 86 | 79 | 90 | 108 | 124 | 117 | 163 | 159 | 160 |
| Leeds | 49 | 42 | 41 | 43 | 43 | 55 | 52 | 62 | 56 | 58 | 59 | 58 |
| Liverpool | 69 | 57 | 53 | 50 | 52 | 64 | 65 | 72 | 77 | 90 | 82 | 92 |
| Manchester | 77 | 60 | 53 | 56 | 56 | 65 | 80 | 80 | 76 | 92 | 77 | 97 |
| Mull and Iona | 206 | 156 | 137 | 92 | 95 | 96 | 110 | 130 | 141 | 189 | 178 | 198 |
| Newcastle and Gateshead | 46 | 41 | 39 | 43 | 42 | 56 | 52 | 64 | 45 | 55 | 71 | 55 |
| Norfolk and the Broads | 55 | 45 | 46 | 39 | 47 | 63 | 57 | 66 | 60 | 70 | 71 | 64 |
| North Coast 500 | 72 | 63 | 57 | 47 | 50 | 55 | 62 | 70 | 66 | 93 | 88 | 70 |
| Irlanda del Norte | 89 | 70 | 71 | 60 | 60 | 69 | 74 | 85 | 70 | 96 | 102 | 93 |
| Nottingham | 59 | 50 | 46 | 48 | 50 | 67 | 65 | 64 | 57 | 72 | 69 | 70 |
| Orkney | 115 | 96 | 87 | 59 | 54 | 56 | 58 | 73 | 91 | 120 | 126 | 114 |
| Oxford | 60 | 47 | 43 | 49 | 57 | 50 | 53 | 62 | 52 | 73 | 71 | 66 |
| Portsmouth and Southampton | 89 | 64 | 56 | 52 | 47 | 57 | 44 | 59 | 60 | 93 | 100 | 97 |
| Salisbury & Stonehenge | 79 | 57 | 54 | 55 | 50 | 54 | 55 | 59 | 58 | 86 | 91 | 85 |
| Sheffield | 76 | 67 | 60 | 59 | 55 | 75 | 62 | 65 | 63 | 79 | 85 | 87 |
| St Andrews and Fife | 63 | 47 | 46 | 44 | 50 | 63 | 64 | 69 | 54 | 80 | 68 | 63 |
| Stirling and the Trossachs | 129 | 97 | 74 | 51 | 57 | 67 | 70 | 76 | 76 | 107 | 109 | 103 |
| Stratford & Warwickshire | 52 | 40 | 40 | 46 | 55 | 52 | 57 | 60 | 51 | 63 | 59 | 56 |
| Los Cotswolds | 83 | 58 | 56 | 56 | 64 | 59 | 59 | 67 | 58 | 84 | 89 | 90 |
| Costa Jurásica | 84 | 60 | 58 | 52 | 45 | 46 | 41 | 55 | 55 | 83 | 99 | 92 |
| Distrito de los Lagos | 172 | 135 | 115 | 83 | 82 | 90 | 95 | 120 | 124 | 175 | 189 | 195 |
| The Outer Hebrides | 145 | 112 | 105 | 74 | 69 | 65 | 74 | 88 | 104 | 133 | 128 | 139 |
| The Peak District | 127 | 116 | 100 | 87 | 82 | 93 | 101 | 101 | 106 | 142 | 136 | 153 |
| Highlands escocesas | 76 | 61 | 53 | 41 | 56 | 62 | 62 | 65 | 63 | 78 | 67 | 73 |
| Gales | 127 | 93 | 85 | 72 | 78 | 74 | 84 | 105 | 86 | 129 | 131 | 140 |
| Windsor | 59 | 45 | 39 | 42 | 46 | 47 | 46 | 53 | 50 | 65 | 67 | 57 |
| York | 49 | 42 | 41 | 43 | 43 | 55 | 52 | 62 | 56 | 58 | 59 | 58 |
No son clasificaciones. «Supera todas las pruebas al aire libre» significa que las medias del Met Office para ese mes se mantienen por debajo de nuestros umbrales de frío, lluvia y días cortos. No significa «el mejor» y no dice nada sobre aglomeraciones ni precios, que no publicamos porque ninguna fuente consultada los indica.
Londres aún no tiene estación del Met Office en nuestros datos: consulte cuándo viajar a Londres. ¿Duda entre dos destinos? Compare destinos.
Fuentes: medias a largo plazo por localidad 1991-2020 del Met Office (Open Government Licence v3.0), con las páginas de estación enlazadas en cada mes; festivos de GOV.UK; organizadores de los eventos, enlazados en cada evento. La duración del día se calcula a partir de la latitud. Las medias describen un mes típico, no una previsión.